Exhibit 99.1
![]()
MANAGEMENT’S DISCUSSION AND ANALYSIS OF THE FINANCIAL SITUATION AND OPERATING RESULTS – FOR THE THREE AND NINE - MONTH PERIODS ENDED DECEMBER 31, 2018 AND 2017
Introduction
This management’s discussion and analysis (“MD&A”) is presented in order to provide the reader with an overview of the financial results and changes to the financial position of Acasti Pharma Inc. (referred to in this MD&A as “Acasti”, “the Corporation”,” we”, “us” and “our”) as at December 31, 2018 and for the three and nine-month periods then ended. This MD&A explains the material variations in the financial statements of operations, financial position and cash flows of Acasti for the three and nine-month periods ended December 31, 2018 and 2017.
Market data and certain industry data and forecasts included in this report were obtained from internal surveys, market research, publicly available information, reports of governmental agencies and industry publications and surveys. We have relied upon industry publications as our primary sources for third-party industry data and forecasts. Industry surveys, publications and forecasts generally state that the information they contain has been obtained from sources believed to be reliable, but that the accuracy and completeness of that information is not guaranteed. We have not independently verified any of the data from third-party sources or the underlying economic assumptions they made. Similarly, internal surveys, industry forecasts and market research, which we believe to be reliable based upon our management’s knowledge of our industry, have not been independently verified. Our estimates involve risks and uncertainties, including assumptions that may prove not to be accurate, and these estimates and certain industry data are subject to change based on various factors, including those discussed under “Risk Factors” in this report. While we believe our internal business research is reliable and the market definitions we use in this report are appropriate, neither our business research nor the definitions we use have been verified by any independent source. This report may only be used for the purpose for which it has been published.
In this MD&A, financial information is for the three and nine-month periods ended December 31, 2018 and 2017 and is based on the interim financial statements of the Corporation, which were prepared in accordance with International Accounting Standard (“IAS”) 34, Interim Financial Reporting, as issued by the International Accounting Standards Board (“IASB”). The Corporation applied the same accounting policies in the preparation of these condensed interim financial statements as those disclosed in note 3 of its most recent annual financial statements. In accordance with its mandate, the Audit Committee of the Corporation’s Board of Directors reviews the contents of the MD&A and recommends its approval to the Board of Directors. The Board of Directors approved this MD&A on February 14, 2019. Disclosure contained in this document is current to that date, unless otherwise noted. Note that there have been no significant changes to the “Use of estimates and measurement uncertainty”, “Critical Accounting Policies”, and “Financial instruments” in comparison to those disclosed in the Corporation’s MD&A for the year ended March 31, 2018, filed with the securities regulatory authorities on June 29, 2018. Readers should carefully review and consider the risks and uncertainties described in the Corporation’s filings with securities regulators, as well as in its Annual Report on Form 20-F filed with securities regulatory authorities on June 29, 2018. The Corporation’s financial results are published in Canadian dollars. All amounts disclosed in this MD&A are in thousands of Canadian dollars, except share and per share amounts or unless otherwise indicated.
| 1 |
Additional information about the Corporation can be found on the SEDAR website at www.sedar.com or on EDGAR at www.sec.gov/edgar.shtml under Acasti Pharma Inc.
The Class A shares of the Corporation (“Common Shares”) are listed for trading on the TSX Venture Exchange and on the NASDAQ Capital Market exchange under the ticker symbol “ACST”.
We own or have rights to trademarks, service marks or trade names that we use in connection with the operation of our business. In addition, our name, logo and website names and addresses are our service marks or trademarks. CaPre® and Onemia® are our registered trademarks. The other trademarks, trade names and service marks appearing in this MD&A are the property of their respective owners. Solely for convenience, the trademarks, service marks, tradenames and copyrights referred to in this MD&A are listed without the ©, ® and TM symbols, but we will assert, to the fullest extent under applicable law, our rights or the rights of the applicable licensors to these trademarks, service marks and tradenames.
FORWARD-LOOKING STATEMENTS
This MD&A contains information that may be forward-looking information within the meaning of Canadian securities laws and forward-looking statements within the meaning of U.S. federal securities laws, both of which we refer to in this MD&A as forward-looking information. Forward-looking information can be identified by the use of terms such as “may”, “will”, “should”, “expect”, “plan”, “anticipate”, “believe”, “intend”, “estimate”, “predict”, “potential”, “continue” or other similar expressions concerning matters that are not statements about the present or historical facts. Forward-looking information in this MD&A includes, among other things, information or statements about:
| · | our ability to conduct all required clinical and nonclinical trials for CaPre, including the timing and results of those trials; |
| · | our strategy, future operations, prospects and the plans of our management; |
| · | the design, regulatory plan, timeline, costs and results of our clinical and nonclinical trials for CaPre; |
| · | the timing and outcome of our meetings and discussions with the U.S. Food and Drug Administration, or FDA; |
| · | our planned regulatory filings for CaPre, and their timing; |
| · | our expectation that our bridging study results will support our plan to get authorization from the FDA to use the 505(b)(2) pathway with new chemical entity, or NCE, status towards a New Drug Application, or NDA, approval in the United States; |
| · | the timing and results from competitor outcomes studies in patients with high triglycerides, or TGs (blood levels between 200-499 mg/dL) and concomitantly taking a statin; |
| · | the potential benefits and risks of CaPre as compared to other products in the pharmaceutical, medical food and natural health products markets; |
| · | our estimates of the size of the potential market for CaPre, unmet medical needs in that market, the potential for market expansion, and the rate and degree of market acceptance of CaPre if it reaches commercialization, and our ability to serve that market; |
| · | our anticipated marketing advantages and product differentiation of CaPre and its potential to become a best-in-class OM3 compound for the treatment of HTG; |
| · | the potential to expand CaPre’s indication for the treatment of high TGs (200-499 mg/dL); |
| · | the degree to which physicians would switch their patients to a product with CaPre’s target product profile; |
| · | our strategy and ability to develop, commercialize and distribute CaPre in the United States and elsewhere; |
| · | the manufacturing scale-up of CaPre beyond 20 tons per year and the related timing; |
| 2 |
| · | our ability to strengthen our patent portfolio and other means of protecting our intellectual property rights, including our ability to obtain additional patent protection for CaPre; |
| · | our expectation that following expiration of the license agreement with Neptune we will not require any license from third parties to support the commercialization of CaPre; |
| · | the availability, consistency and sources of our raw materials, including krill oil; |
| · | our expectation to be able to rely on third parties to manufacture CaPre whose manufacturing processes and facilities are in compliance with current good manufacturing practices, or cGMP; |
| · | the potential for Omega-3 therapeutics, or OM3s in other cardiometabolic medicine indications; |
| · | our intention and ability to build a US commercial organization and to successfully launch CaPre and compete in the US market; |
| · | our intention and ability to complete development and/or distribution partnerships to support the commercialization of CaPre outside of the US, and to pursue strategic opportunities to provide capital and market access; |
| · | our need for additional financing and our estimates regarding our future financing and capital requirements; |
| · | our expectation regarding our financial performance, including our revenues, profitability, research and development, costs and expenses, gross margins, liquidity, capital resources, and capital expenditures; and |
| · | our projected capital requirements to fund our anticipated expenses, including our research and development and general and administrative expenses, and capital expenditures. |
Although the forward-looking information in this MD&A is based upon what we believe are reasonable assumptions, you should not place undue reliance on that forward-looking information since actual results may vary materially from it. Important assumptions made by us when making forward-looking statements include, among other things that:
| · | we are able to obtain the additional capital and financing we require; |
| · | we successfully and timely complete all required clinical and nonclinical trials necessary for regulatory approval of CaPre; |
| · | we successfully enroll and randomize patients in our TRILOGY Phase 3 program; |
| · | the timeline and costs for our clinical and nonclinical programs are not materially underestimated or affected by unforeseen circumstances; |
| · | CaPre is safe and effective; |
| · | outcome study data from our competitors in high HTG patients concomitantly taking a statin is positive; |
| · | we obtain and maintain regulatory approval for CaPre on a timely basis; |
| · | we are able to attract, hire and retain key management and skilled scientific personnel; |
| · | third parties provide their services to us on a timely and effective basis; |
| · | we are able to maintain our required supply of raw materials, including krill oil; |
| · | we are able to find and retain a third-party to manufacture CaPre in compliance with cGMP; |
| · | we are able to successfully build a commercial organization, launch CaPre in the US, and compete in the US market; |
| · | we are able to secure distribution arrangements for CaPre, if it reaches commercialization; |
| · | we are able to manage our future growth effectively; |
| 3 |
| · | we are able to gain acceptance of CaPre in its markets and we are able to serve those markets; |
| · | our patent portfolio is sufficient and valid; |
| · | we are able to secure and defend our intellectual property rights and to avoid infringing upon the intellectual property rights of third parties; |
| · | we are able to take advantage of business opportunities in the pharmaceutical industry and receive strategic partner support; |
| · | we are able to continue as a going concern; |
| · | there is no significant increase in competition for CaPre from other companies in the pharmaceutical, medical food and natural health product industries; |
| · | CaPre would be viewed favorably by payers at launch and receive appropriate healthcare reimbursement; |
| · | market data and reports reviewed by us are accurate; |
| · | there are no adverse changes in relevant laws or regulations; and |
| · | we face no product liability lawsuits and other proceedings or any such matters, if they arise, are satisfactorily resolved. |
In addition, the forward-looking information in this MD&A is subject to a number of known and unknown risks, uncertainties and other factors, including those described in this MD&A under the heading “Risk Factors”, many of which are beyond our control, that could cause our actual results and developments to differ materially from those that are disclosed in or implied by the forward-looking information, including, among others:
| · | risks related to timing and possible difficulties, delays or failures in our planned TRILOGY Phase 3 program for CaPre; |
| · | nonclinical and clinical trials may be more costly or take longer to complete than anticipated, and may never be initiated or completed, or may not generate results that warrant future development of CaPre; |
| · | CaPre may not prove to be as safe and effective or as potent as we currently believe; |
| · | our planned TRILOGY Phase 3 program may not produce positive results; |
| · | our anticipated studies and submissions to the FDA may not occur as currently anticipated, or at all; |
| · | the FDA could reject our 505(b)(2) regulatory pathway; |
| · | while the REDUCE-IT results (a Cardiovascular outcome study conducted by Amarin with their OM3 drug VASCEPA) were positive, the cardiovascular outcome study data from the STRENGTH study (conducted by Astra Zeneca with their OM3 drug EPANOVA) in patients with high TGs could be negative, which could also negatively affect the market perception of CaPre; |
| · | we may encounter difficulties, delays or failures in obtaining regulatory approvals for the initiation of clinical trials or to market CaPre; |
| · | we may need to conduct additional future clinical trials for CaPre, the occurrence and success of which cannot be assured; |
| · | CaPre may have unknown side effects; |
| · | the FDA may refuse to approve CaPre, or place restrictions on our ability to commercialize CaPre; |
| · | CaPre could be subject to extensive post-market obligations and continued regulatory review, which may result in significant additional expense and affect sales, marketing and profitability; |
| · | we may fail to achieve our publicly announced milestones on time; |
| 4 |
| · | we may encounter difficulties in completing the development and commercialization of CaPre; |
| · | third parties we will rely upon to conduct our TRILOGY Phase 3 program for CaPre may not effectively fulfill their obligations to us, including complying with FDA requirements; |
| · | there may be difficulties, delays, or failures in obtaining health care reimbursements for CaPre; |
| · | recently enacted and future laws may increase the difficulty and cost for us to obtain marketing approval of and commercialize CaPre and affect the prices we can charge; |
| · | new laws, regulatory requirements, and the continuing efforts of governmental and third-party payors to contain or reduce the costs of healthcare through various means could adversely affect our business; |
| · | the market opportunity for, and demand and market acceptance of, CaPre may not be as strong as we anticipate; |
| · | third parties that we will rely upon to manufacture, supply and distribute CaPre may not effectively fulfill their obligations to us, including complying with FDA requirements; |
| · | there may not be an adequate supply of raw materials, including krill oil, in sufficient quantities and quality and to produce CaPre under cGMP standards; |
| · | Neptune still has some influence with respect to matters submitted to our shareholders for approval; Neptune’s interest may not align with those of us or our other shareholders; |
| · | we may not be able to meet applicable regulatory standards for the manufacture of CaPre or scale-up our manufacturing successfully; |
| · | we may not be able to produce clinical batches of CaPre in a timely manner or at all; |
| · | as a company, we have limited sales, marketing and distribution experience; |
| · | our patent applications may not result in issued patents, our issued patents may be circumvented or challenged and ultimately struck down, and we may not be able to successfully protect our trade secrets or other confidential proprietary information; |
| · | we may face claims of infringement of third party intellectual property and other proprietary rights; |
| · | we may face product liability claims and product recalls; |
| · | we may face intense competition from other companies in the pharmaceutical, medical food and natural health product industries; |
| · | we have a history of negative operating cash flow and may never become profitable or be able to sustain profitability; |
| · | we have significant additional future capital needs and may not be able to raise additional financing required to fund further research and development, clinical studies, obtain regulatory approvals, build a commercial organization in the US, and meet ongoing capital requirements to continue our current operations on commercially acceptable terms or at all; |
| · | we may not be able to successfully compete in the US market with competitors who are larger and have more resources than we do; |
| · | we may acquire businesses or products or form strategic partnerships in the future that may not be successful; |
| · | we may be unable to secure development and/or distribution partnerships to support the development and commercialization of CaPre outside the US, provide development capital, or market access; |
| · | we rely on the retention of key management and skilled scientific personnel; and |
| · | general changes in economic and capital market conditions could adversely affect us. |
| 5 |
All of the forward-looking information in this MD&A is qualified by this cautionary statement. There can be no guarantee that the results or developments that we anticipate will be realized or, even if substantially realized, that they will have the consequences or effects on our business, financial condition or results of operations that we anticipate. As a result, you should not place undue reliance on the forward-looking information. Except as required by applicable law, we do not undertake to update or amend any forward-looking information, whether as a result of new information, future events or otherwise. All forward-looking information is made as of the date of this MD&A.
Caution Regarding Non-IFRS Financial Measures
The Corporation uses multiple financial measures for the review of its operating performance. These measures are generally IFRS financial measures, but one adjusted financial measure, Non-IFRS operating loss, is also used to assess its operating performance. This non-IFRS financial measure is directly derived from the Corporation’s financial statements and is presented in a consistent manner. The Corporation uses this measure, in addition to the IFRS financial measures, for the purposes of evaluating its historical and prospective financial performance, as well as its performance relative to competitors and to plan and forecast future periods as well as to make operational and strategic decisions. The Corporation believes that providing this Non-IFRS information to investors, in addition to IFRS measures, allows them to see the Corporation’s results through the eyes of management, and to better understand its historical and future financial performance.
Earnings and other measures adjusted to a basis other than IFRS do not have standardized meanings and are unlikely to be comparable to similar measures used by other companies. Accordingly, they should not be considered in isolation. The Corporation uses Non-IFRS operating loss to measure its performance from one period to the next without the variation caused by certain adjustments that could potentially distort the analysis of trends in its operating performance, and because the Corporation believes it provides meaningful information on the Corporation’s financial condition and operating results. Acasti’s method for calculating Non-IFRS operating loss may differ from that used by other corporations.
Acasti calculates its Non-IFRS operating loss measurement by adding to net loss finance expenses that includes change in fair value of derivative warrant liabilities, depreciation and amortization, impairment loss, change in fair value of derivative warrant liabilities, and stock-based compensation and by subtracting finance income and deferred tax recovery. Items that do not impact core operating performance of the Corporation are excluded from the calculation as they may vary significantly from one period to another. Finance income/expenses include foreign exchange gain (loss). Acasti also excludes the effects of certain non-monetary transactions recorded, such as stock-based compensation, from its Non-IFRS operating loss calculation. Excluding this item does not imply it is necessarily non-recurring.
A reconciliation of net loss to Non-IFRS operating loss is presented later in this MD&A.
BUSINESS OVERVIEW
Our Business
We are a biopharmaceutical innovator focused on the research, development and commercialization of prescription drugs using omega-3, or OM3, fatty acids and phospholipids, or PLs, derived from krill oil. OM3 fatty acids have extensive clinical evidence of safety and efficacy in lowering triglycerides, or TGs, in patients with hypertriglyceridemia, or HTG. Our lead product candidate is CaPre, an OM3 phospholipid therapeutic, which we are developing initially for the treatment of severe HTG, a condition characterized by very high or severe levels of TGs in the bloodstream (≥ 500 mg/dL). In accordance with a study published in 2009 in the Archives of Internal Medicine by Ford et al., it is estimated that three to four million people in the United States have severe HTG. In primary qualitative market research studies with Key Opinion Leaders (KOLs), High Volume Prescribers (HVPs) and Pharmacy Benefit Managers commissioned by Acasti in August 2016 and November of 2017 by DP Analytics, a division of Destum Partners, physicians interviewed indicated a significant unmet medical need exists for an effective, safe and well-absorbing OM3 therapeutic that can also demonstrate a positive impact on the major blood lipids associated with cardiovascular disease, or CVD, risk. We believe that CaPre will address this unmet medical need if our Phase 3 results reproduce what we observed in our Phase 2 data. We initiated TRILOGY, our Phase 3 clinical program in North America during the second half of 2017 and started clinical site activation as planned at the end of 2017. As of the date of this MD&A, patient enrollment and randomization is continuing on schedule for both studies. We also believe the potential exists to expand CaPre’s initial indication to the roughly 36 million patients with high TGs (blood levels between 200 – 499 mg/dL), although at least one additional clinical trial would likely be required to support FDA approval of a Supplemental New Drug Application (SNDA) to expand CaPre’s indications to this segment. Data from our Phase 2 studies indicated that CaPre may have a positive effect in diabetes and other inflammatory diseases, consequently we may also seek to identify new potential indications for CaPre that may be appropriate for future studies and pipeline expansion. In addition, we may also seek to in-license other cardiometabolic drug candidates for drug development and commercialization.
| 6 |
In four clinical trials conducted to date, we saw the following consistent results with CaPre, and we are seeking to demonstrate similar safety and efficacy in our TRILOGY Phase 3 program:
| · | significant reduction of TGs and non-high density lipoprotein cholesterol (non-HDL-C) levels in the blood of patients with mild to severe HTG; |
| · | no deleterious effect on low-density lipoprotein cholesterol (LDL-C), or “bad” cholesterol, with the potential to reduce LDL-C; |
| · | potential to increase high-density lipoprotein cholesterol (HDL-C), or “good” cholesterol; |
| · | potential to benefit diabetes patients by decreasing hemoglobin A1c (HbA1c), a marker of glucose control; |
| · | good bioavailability (absorption by the body), even under fasting conditions; |
| · | no significant food effect when taken with either low-fat or high-fat meals; and |
| · | an overall safety profile similar to that demonstrated by currently marketed OM3s. |
We believe that if we are able to reproduce these results in our TRILOGY Phase 3 program, we potentially could set CaPre apart from current FDA-approved OM3 treatment options, and it could give us a significant clinical and marketing advantage.
About Hypertriglyceridemia (HTG)
According to the American Heart Association Scientific Statement on Triglycerides and Cardiovascular Disease from 2011, TG levels provide important information as a marker associated with the risk for heart disease and stroke, especially when an individual also has low levels of HDL-C and elevated levels of LDL-C. HTG can be caused by both genetic and environmental factors, including obesity, sedentary lifestyle and high-calorie diets. HTG is also associated with comorbid conditions such as chronic renal failure, pancreatitis, nephrotic syndrome, and diabetes. Multiple epidemiological, clinical, genetic studies suggest that patients with elevated TG levels (≥ 200 mg/dL) are at a greater risk of coronary artery disease, or CAD, and pancreatitis, a life-threatening condition, as compared to those with normal TG levels. The genes regulating TGs and LDL-C are equally strong predictors of CAD, but HDL-C is not. Other studies suggest that lowering and managing TG levels may reduce these risks. For example, the Japan EPA Lipid Intervention Study, or JELIS, demonstrated the long-term benefit of an OM3 eicosapentaenoic acid, or EPA, in preventing major coronary events in hypercholesterolemia patients receiving statin treatment. JELIS found a 19% relative risk reduction in major coronary events in patients with relatively normal TGs but a more pronounced 53% reduction in the subgroup with TGs > 150mg/dL and HDL-C < 40mg/dL. Recently published meta-analyses by Alexander et al. (Mayo Clinic Proceedings, 2017) and Maki et al. (Journal of Clinical Lipidology, 2016) suggest that EPA and docosahexaenoic acid, or DHA, may be associated with reducing coronary heart disease risk to a greater extent in populations with elevated TG levels, and that drugs lowering TG and TG-rich lipoproteins may reduce cardiovascular event risk in patients with elevated TG levels, particularly if associated with low HDL-C. More recently in November of 2018, Amarin published the results of their REDUCE-IT cardiovascular outcome trial (CVOT), which showed that a therapeutic dose of VASCEPA at 4 grams per day taken on top of a statin, reduced residual cardiovascular risk by 25%. Astra Zeneca is currently investigating the potential for EPANOVA, their therapeutic OM3, taken with a statin to reduce cardiovascular risk in patients with elevated levels of TGs in their ongoing STRENGTH CVOT.
| 7 |
About CaPre
CaPre is a highly purified, proprietary krill oil-derived mixture containing polyunsaturated fatty acids, or PUFAs, primarily composed of OM3 fatty acids, principally EPA, and DHA, present as a combination of phospholipid esters and free fatty acids. EPA and DHA are well known to be complementary and beneficial for human health, and according to numerous recent clinical studies, may promote healthy heart, brain and visual function (Kwantes and Grundmann, Journal of Dietary Supplements, 2014), and may also contribute to reducing inflammation and blood TGs (Ulven and Holven, Vascular health and risk management, 2015). Krill is a natural source of phospholipids and OM3 fatty acids. The EPA and DHA contained in CaPre are delivered as a combination of OM3s as free fatty acids and OM3s bound to phospholipid esters. Both forms allow these PUFAs to reach the small intestine where they undergo rapid absorption and transformation into complex fat molecules that are required for lipid transport in the bloodstream. We believe that EPA and DHA are more efficiently transported by phospholipids sourced from krill oil than the EPA and DHA contained in fish oil that are transported either by TGs (as in dietary supplements) or as ethyl esters in other prescription OM3 drugs (such as LOVAZA and VASCEPA), which must then undergo additional digestion before they are ready for transport into the bloodstream. The digestion and absorption of OM3 ethyl ester drugs requires a particular enzymatic process that is highly dependent on the fat content of a meal – the higher the fat content, the better the OM3 ethyl ester absorption. High fat content meals are not recommended in patients with HTG. We believe that CaPre’s superior absorption profile could represent a significant clinical advantage, since taking it with a low-fat meal represents a healthier and more realistic regimen for patients with HTG who must follow a restricted low-fat diet.
CaPre is intended to be used as a therapy combined with positive lifestyle changes, such as a healthy diet and exercise, and can be administered either alone or with other drug treatment regimens such as statins (a class of drug used to reduce LDL-C) or fibrates (another class of drug used to reduce TGs). CaPre is intended to be taken orally once or twice per day in capsule form.
Potential Market for CaPre
We believe a significant opportunity exists for OM3 market expansion because, among other things:
| · | cardiovascular diseases, or CVD, and stroke are the leading causes of morbidity and mortality in the United States. The burden of CVD and stroke in terms of life-years lost, diminished quality of life, and direct and indirect medical costs also remains enormous; |
| · | evidence suggests potential for OM3s in other cardiometabolic indications; and |
| · | based on the assumption that the REDUCE-IT trial sponsored by Amarin and the STRENGTH trial sponsored by Astra Zeneca, will be positive, key opinion leaders interviewed by DP Analytics in the market research study described further below estimated that they would increase their own prescribing of OM3s by 43% in patients with high TGs (blood levels between 200 – 499 mg/dL) and by 35% in patients with severe HTG (Qualitative market research with Key Opinion Leaders (KOLs) and High Volume Prescribers (HVPs) conducted for Acasti in November, 2017 by Destum Partners, an independent market research firm). |
Except as otherwise indicated, all of the information that follows under this heading has been derived from secondary sources, including audited U.S. prescribing data, and from a qualitative U.S. commercial and primary market research assessment conducted for us by DP Analytics, A Division of Destum Partners, Inc., or Destum, a market research firm, dated August 19, 2016, which we refer to as the Destum Market Research. In its market analysis for CaPre, Destum utilized secondary market data and reports and conducted primary qualitative market research with physicians and third-party payers, such as PBMs. One-on-one in-depth phone interviews lasting on average 30-60 minutes were conducted with 22 physicians and 5 PBMs, and key qualitative data was obtained by Destum on current clinical practice for treating patients with HTG, and their perceptions of the current unmet medical need in treating patients with HTG. All interviews were conducted by the same individual at Destum and recorded to ensure consistency and collection of key data points. Destum utilized OM3 prescription data from 2009 to 2017 to estimate the size of CaPre’s potential market. Based on its discussions with the PBMs, Destum also assumed CaPre would be viewed favorably by payers at launch (e.g., Tier 2 or 3, depending on payer plan, which is comparable to LOVAZA and VASCEPA). Upon completing the screening questionnaire and being approved for inclusion in Destum’s study, key opinion leaders, or KOLs, and high volume prescribers, or HVPs, were provided with a study questionnaire and were asked to comment on a target profile for a potential new OM3 “Product X” offering a “trifecta” of cardio-metabolic benefits similar to the potential efficacy and safety benefits demonstrated by CaPre in our two Phase 1 pharmacokinetic studies and two Phase 2 clinical trials, which we refer to as the Target Product Profile. Respondents were told that the unidentified product was being prepared for a Phase 3 program designed to confirm with statistical significance the product’s safety and efficacy in patients with severe HTG. The Target Product Profile was used by Destum strictly for market research analysis purposes and should not be construed as an indication of future performance of CaPre and should not be read as an expectation or guarantee of future performance or results of CaPre, and will not necessarily be an accurate indication of whether or not such results will be achieved by CaPre in our Phase 3 program.
| 8 |
According to the American Heart Association, the prevalence of HTG in the United States and globally correlates to the aging of the population and the increasing incidence of obesity and diabetes. Market participants, including the American Heart Association, have estimated that one-third of adults in the United States have elevated levels of TGs (TGs >150 mg/dL) (Ford, Archives of Internal Medicine, 2009; 169(6):572-578), including approximately 36 million people diagnosed with high HTG, and 3 to 4 million people diagnosed with severe HTG (Miller et al. Circulation, 2011 and Maki et al. J. Clin. Lipid, 2012). Moreover, according to Ford, Archives of Internal Medicine in a study conducted between 1999 and 2004, 18% of adults in the United States, corresponding to approximately 40 million people, had elevated TG levels equal to or greater than 200 mg/dl, of which only 3.6% were treated specifically with TG-lowering medication (Ford, Archives of Internal Medicine, 2009; 169(6):572-578; Kapoor and Miller, ACC, 2016, Christian et al. Am. J. Cardiology, 2011). We believe this data indicates there is a large underserved market opportunity for CaPre.
In 2015, CaPre’s target market in the United States for treatment of HTG was estimated by IMS NSP Audit data to be approximately US$750 million annually, with approximately five million prescriptions written annually over the prior four years. The total global market for treatment of HTG was estimated by GOED Proprietary Research in 2015 to be approximately US$2.3 billion annually. Currently, all marketed OM3 products are approved by the FDA only for patients with severe HTG. We believe there is the potential to greatly expand the treatable market in the United States to the approximately 36 million people with high TGs, assuming the FDA approves expanded labeling for VASCEPA based on positive REDUCE-IT outcome study results, and favorable results are reported from the STRENGTH outcome trial which is currently ongoing. Amarin recently released positive top-line results from its cardiovascular outcome study (the REDUCE-IT trial) and the cardiovascular outcome study sponsored by AstraZeneca (the STRENGTH trial) is expected to be reported in late 2019 or early 2020. These CV studies are designed to evaluate the long-term benefit of lowering TGs on CV risks with prescription drugs containing OM3 fatty acids in patients concurrently taking a statin. Additional clinical trials would likely be required for CaPre to also expand its label claims to the high TGs segment. Given the large portion of the adult population in the United States that have elevated levels of TGs above 200 mg/dL but who go largely untreated, we believe there is the potential for a very significant increase in the total number of patients eligible for treatment if these CV outcome trials are positive.
CaPre has two FDA-approved and marketed branded competitors (LOVAZA and VASCEPA). In addition, Astra Zeneca has an FDA-approved product, EPANOVA, which has not yet been launched. LOVAZA generics became available on the U.S. market in 2013. In spite of generic options, audited prescription data from IMS NSP Audit suggests that over 50% of OM3 prescriptions are written for branded products (LOVAZA or VASCEPA). By 2015, there had been only an approximately 25% decline in total market value, in spite of some generic switching that occurs at pharmacies. This stability of branded products is due in part to the fact that the pricing differential between branded and generic OM3 products is smaller than is often the case between branded and generic products in the pharmaceutical industry. Based on both primary market research with pharmacy benefit managers, or PBMs, and audited prescription reports, the average pricing of generics is currently approximately US$190 per month, while pricing for branded products averages between US$250 and US$300 per month. Amarin has raised prices for VASCEPA annually since its launch in late 2013. PBMs offer “Preferred Brand” status (Tier 2 or Tier 3), without significant restrictions (i.e., no prior authorization, step edits, or high co-payments) for these branded OM3s. By the end of 2017, it is estimated that VASCEPA had reached about 30% market share in the U.S., in spite of generic competition from LOVAZA.
While conducting the Destum Market Research, KOLs and HVPs interviewed by Destum were asked to assess the level of unmet medical need associated with treating patients with severe HTG based on currently available treatment options. 91% of physicians interviewed by Destum in 2016 indicated that they believe that the current unmet medical need for treating HTG was moderate to high. That number increased to 100% in the subsequent 2017 research. The reasons identified by these physicians for their dissatisfaction with the currently available OM3s included insufficient lowering of TGs (principally relating to VASCEPA), negative LDL-C effects (principally relating to LOVAZA), the “food effect” or reduced absorption of both LOVAZA and VASCEPA when taken with a low-fat meal, gastrointestinal side effects, and the fishy taste from these fish oil-derived OM3s. Despite the availability of other drug classes to treat severe HTG, interviewed physicians indicated that they would welcome the introduction of new and improved OM3 products, particularly if they can address these perceived deficiencies.
| 9 |
Interviewed physicians responded favorably to the blinded Target Product Profile of CaPre in the Destum Market Research studies. In the most recent study conducted in 2017, they indicated that they would prescribe a new OM3 drug with the Target Product Profile to approximately 82% of their patients in the severe HTG patient population and 68% of their patients in the high HTG segment within two years of the new OM3 drug’s approval. Approximately 60% of the interviewed physicians indicated that they would switch to a drug with the Target Product Profile primarily due to the “trifecta effect” of reducing TGs and LDL-C while elevating HDL-C, and the remaining 40% indicated they would switch primarily due to a drug with the Target Product Profile due to the effective reduction of TGs alone. In connection with their responses, the interviewed physicians were instructed to assume the drug with the Target Product Profile and all currently available OM3 products were not subject to any reimbursement or coverage hurdles (e.g., all products were on an equal health care coverage playing field). This assumption was supported by our interviews with leading PBMs in the United States.
We plan to conduct additional market research with KOLs, HVPs, primary care physicians and payers to further develop and refine our understanding of the potential market for CaPre.
Our Clinical Data
CaPre is being developed by us for the treatment of patients with severe HTG. In two Phase 2 clinical trials conducted by us in Canada (our COLT and TRIFECTA trials), CaPre was well-tolerated at all doses tested, with no serious adverse events that were considered treatment-related. Among the reported adverse events with an occurrence of greater than 2% of subjects and greater than placebo, only diarrhea had an incidence of 2.2%.
In both Phase 2 clinical trials, CaPre significantly lowered TGs in patients with mild to severe HTG. Importantly, in these studies, CaPre also demonstrated no deleterious effect on LDL-C (unlike LOVAZA and EPANOVA, which have been shown to significantly increase LDL-C in patients with severe HTG). Further, our Phase 2 data indicated that unlike LOVAZA, CaPre may actually reduce LDL-C with a 4 gram per day dose (a dose equivalent to VASCEPA and LOVAZA). LDL-C is undesirable because it accumulates in the walls of blood vessels, where it can cause blockages (atherosclerosis). In the Phase 2 trials, CaPre also reduced non-HDL-C (all cholesterol contained in the bloodstream except HDL-C), which is also considered to be a marker of cardiovascular disease. The COLT trial data showed a mean increase of 7.7% in HDL-C with CaPre at 4 grams per day (p=0.07). Further analysis of the data from our on-going TRILOGY Phase 3 program will be required to demonstrate CaPre’s statistical significance with respect to lowering LDL-C and increasing HDL-C. Finally we saw a statistically significant reduction of HbA1c in the CaPre 4g treatment group in the COLT study after only 8 weeks on drug. This interesting and potentially differentiating effect will investigated more thoroughly in our TRILOGY Phase 3 program where patients will be followed for 6 months.
We believe that these multiple potential cardiometabolic benefits, if confirmed in our on-going TRILOGY Phase 3 program, could be significant differentiators for CaPre in the marketplace, as no currently approved OM3 drug has shown an ability to positively modulate all four of these major blood lipids (TGs, non-HDL-C, LDL-C and HDL-C) in the treatment of severe HTG. We also believe that if supported by additional clinical trials, CaPre has the potential to become the best-in-class OM3 compound for the treatment of mild to moderate HTG.
In summary, in addition to reducing TG levels in patients with mild to severe HTG, clinical data collected by us to date indicates that CaPre may also have:
| · | beneficial clinical effects on other blood lipids, such as HDL-C (good cholesterol) and non-HDL-C; |
| · | no deleterious effect on, and may potentially reduce, LDL-C (bad cholesterol) levels; |
| · | potential to benefit diabetes patients by reducing HbA1c, an important marker of diabetes; and |
| 10 |
| · | absorption capability that unlike VASCEPA and LOVAZA, is not meaningfully affected by the fat content of a meal consumed prior to drug administration, providing patients with the reassurance that following their physician-recommended low-fat diet will still result in high absorption. |
We believe that these features could set CaPre apart from currently available FDA-approved OM3 treatment options in the marketplace and could give us a significant clinical and marketing advantage.
Our Nonclinical Research
In addition to our Phase 2 clinical trials, we carried out an extensive nonclinical program to demonstrate the safety of CaPre in a defined set of studies required by the FDA. These studies were carried out by contract research organizations in compliance with Good Laboratory Practices (GLPs) and conducted on various species of animals recommended by the FDA to investigate the long-term effects of CaPre at doses of up to 65 grams of human equivalent dose over 39 weeks. In these studies, hematological, biochemical, coagulation and overall health parameters of CaPre were evaluated and no toxic effects were observed in any of the segments of the studies. Other studies focused on the potential toxic effects of CaPre on vital systems, such as the cardiovascular, respiratory and central nervous system as evaluated by behavioral studies of the various species. These studies showed that CaPre did not have any adverse or toxic effects on any of the vital systems investigated, again up to doses well above the recommended clinical dose of CaPre. To rule out short term toxic effects of CaPre on genes, genomic toxicity studies were undertaken on accepted cellular and animal models. These studies showed no toxic effects of CaPre on any of the genetic markers indicative of potential gene altering toxic effects.
We believe the studies conducted to date indicate that CaPre is well-tolerated and shows no toxic effects on any of the physiological and vital systems of the tested animals or their genes at doses well above CaPre’s anticipated clinical therapeutic dose of 4 grams daily.
In parallel to our TRILOGY Phase 3 program, Acasti is currently completing additional nonclinical studies, including a pre- and postnatal development study in rodents and a 26-week oral carcinogenicity study in transgenic homozygous rasH2 mice. Both study protocols were pre-approved by FDA by means of Special Protocol Assessment (SPA) through FDA Executive CAC. These nonclinical studies are required to support an NDA filing for CaPre.
Our TRILOGY Phase 3 Program
In March 2017, we announced our plans to proceed with our TRILOGY Phase 3 program following our End-of-Phase 2 meeting with the FDA in February 2017. Based on the guidance we have received from the FDA, we are now actively conducting two pivotal, randomized, placebo-controlled, double-blinded Phase 3 studies to evaluate the safety and efficacy of CaPre in patients with severe HTG. These studies of 26-week duration will evaluate CaPre’s ability to lower TGs from baseline in approximately 500 patients (approximately 250 per study) randomized to either 4 grams daily or placebo. The FDA’s feedback supported our plan to conduct two studies in parallel, potentially reducing the cost and shortening the time to an NDA submission. These studies will be conducted in approximately 150 sites across North America.
The primary endpoint of these studies is to determine the efficacy of CaPre at 4 grams/day compared to placebo in lowering TGs after 12 weeks in severe HTG patients, and to confirm safety. The study was designed to provide at least 90% statistical power to detect a difference of at least a 20% decrease from baseline in TGs between CaPre and placebo. In addition, the Phase 3 studies will include numerous secondary and exploratory endpoints, which are designed to assess the effect of CaPre on the broader lipid profile and certain metabolic, inflammatory and CVD risk markers.
In November 2017, we announced that Dariush Mozaffarian, M.D., Dr.P.H., agreed to serve as the principal investigator of our Phase 3 clinical program. Dr. Mozaffarian is a cardiologist and epidemiologist serving as the Jean Mayer Professor of Nutrition & Medicine, and the Dean of the Friedman School of Nutrition Science & Policy at Tuft’s University. His widely published research focuses on how diets, such as those rich in OM3s and lifestyle influence cardiometabolic health, and how effective policies can improve health and wellness.
Late in 2017, based on feedback from the FDA, we finalized our Chemistry, Manufacturing, and Controls plans and the clinical trial design that supports Acasti’s TRILOGY Phase 3 program. In parallel with the Phase 3 clinical trial planning, additional current Good Manufacturing Practices (cGMP) production lots of API (known as NKPL66) and CaPre were manufactured during the fourth quarter of our fiscal year ending March 31, 2018 and the first quarter of our current fiscal year, enabling Acasti to continue to build the CaPre and placebo inventory required to support the activated clinical trial sites and patient randomization. In the first calendar quarter of 2018, additional raw krill oil was purchased from an alternative supplier, and additional lots of CaPre have been manufactured with this material for use in the Phase 3 program. With manufacturing of its clinical trial material nearing completion, Acasti is now allocating additional technical resources to other activities related to the planned commercial launch of CaPre.
| 11 |
We initiated our TRILOGY program and began site activation and patient enrollment on schedule at the end of 2017. We are working with a major clinical research organization to manage our TRILOGY Phase 3 program. The TRILOGY studies progressed on schedule throughout 2018, and continued to advance in the third quarter of our current fiscal year. As of December 31, 2018, TRILOGY had essentially completed enrollment with greater than >65% of patients randomized at more than 150 clinical sites across the U.S., Canada, and Mexico. The study is proceeding on schedule, and we continue to expect topline results before the end of 2019.
We initiated our TRILOGY program and began site activation and patient enrollment on schedule at the end of 2017. We are working with a major clinical research organization to manage our TRILOGY Phase 3 program. The TRILOGY studies progressed on schedule throughout 2018, and continued to advance in the third quarter of our current fiscal year. As of December 31, 2018, TRILOGY had essentially completed enrollment with greater than >65% of patients randomized at more than 150 clinical sites across the U.S., Canada, and Mexico.
Our first study, designated as TRILOGY 001, is being conducted exclusively in the US and will have a total of approximately 250 patients when fully randomized. The TRILOGY 002 study will also have approximately 250 patients when fully randomized, and is being conducted in the US, Canada and Mexico. Based on current trends, we currently project that TRILOGY 001 may complete as much as 1 to 2 months ahead of TRILOGY 002. Consequently, we expect to report topline results independently for each study as we receive the results.
As of February 12, 2019, over 74% of patients had been randomized in total for both TRILOGY studies clinical sites across the U.S., Canada, and Mexico. Furthermore, about 24% of patients who had previously been randomized have already finished the study. Based on current trends, we continue to project that we remain on schedule to report topline results by the end of 2019.
Our Regulatory Strategy for CaPre
Our strategy is to develop and initially commercialize CaPre for the treatment of severe HTG. The TRILOGY Phase 3 program was initiated during the second half of 2017 and has been designed to evaluate the clinical effect of CaPre on TGs, non-HDL-C, LDL-C, and HDL-C levels together with a variety of other cardiometabolic biomarkers in patients with severe HTG.
We intend to pursue a 505(b)(2) regulatory pathway towards an NDA approval in the United States. A 505(b)(2) regulatory pathway is defined in the U.S. Federal Food Drug and Cosmetic Act (FDCA) as an NDA containing investigations of safety and effectiveness that are being relied upon for approval and were not, in whole, conducted by or for the applicant, and for which the applicant has not obtained a right of reference. 505(b)(2) regulatory pathways differ from a typical NDA because they allow a sponsor to rely, at least in part, on the FDA’s findings of safety and/or effectiveness for a previously approved drug. We intend to pursue the 505(b)(2) regulatory pathway as a strategy to leverage the large body of safety data for LOVAZA, which could accelerate and streamline the development of CaPre and reduce associated costs and risks. This pathway still allows CaPre to retain its New Chemical Entity (NCE) status due to its novel, patented OM3 free fatty acid/phospholipid formulation.
In connection with our intended use of the 505(b)(2) pathway, the FDA supported our proposal to conduct our Bridging Study that compared CaPre (which has an OM3 free fatty acid/phospholipid composition) with the FDA-approved HTG drug LOVAZA (which has an OM3-acid ethyl esters composition) in healthy volunteers. In February 2017, we met with the FDA at an End-of-Phase 2 meeting where our Bridging Study data was discussed. We confirmed with the FDA the 505(b)(2) regulatory approach to use the safety data for LOVAZA and finalized the study design for our Phase 3 program that would be required for NDA approval.
| 12 |
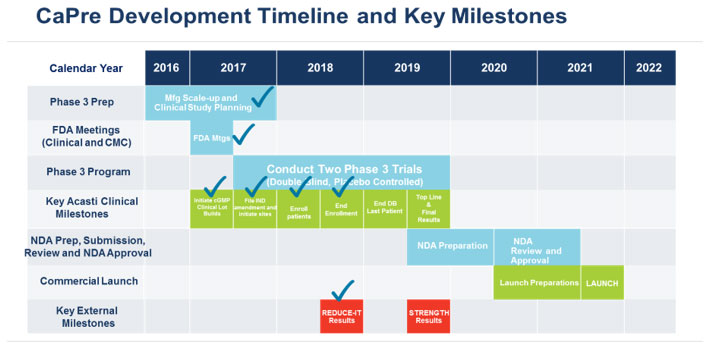
Our planned remaining key development and regulatory milestones and timeline are presented below.
Our Intellectual Property Strategy
Under a license agreement we entered into with Neptune in August 2008, which was later amended on February 9, 2009 and March 7, 2013 (the “License Agreement”), we received an exclusive license to use certain intellectual property of Neptune (which includes several patents) to develop and commercialize CaPre and our novel and active pharmaceutical ingredients, or APIs, for use in pharmaceutical and medical food applications in the cardiometabolic field. The term of the License Agreement expires on the date of the last-to-expire licensed patents in 2022. As a result of a royalty prepayment transaction we entered into with Neptune on December 4, 2012, we are no longer required to pay any royalties to Neptune under the License Agreement during its term for the use of the licensed intellectual property.
Upon the expiry of our license agreement with Neptune, we believe that CaPre will be covered under our own issued and pending patents, and we do not believe that we will afterwards require any license from Neptune to support the commercialization of CaPre.
We currently have patents granted and allowed in the following countries: US, Canada, Russia, Europe (Belgium, Switzerland, Germany, Denmark, Spain, Finland, France, United Kingdom, Italy, Netherlands, Norway, Portugal and Sweden), Japan, Israel, Australia, China, Mexico, Panama, Saudi Arabia, Taiwan, South Africa, and Korea. We continue to expand our own intellectual property, or IP, patent portfolio. We have filed patent applications in more than 20 jurisdictions, including with the European Patent Office (but excluding the individual countries where we have subsequently registered), and in countries in North America, Asia and Australia for our “Concentrated Therapeutic Phospholipid Composition”, or Proprietary Composition, to treat HTG. We currently have more than 20 issued or allowed patents and numerous patent applications pending.
We believe these patents and patent applications increase potential commercial opportunities for CaPre, including through possible licensing and partnership opportunities. We are committed to building a global portfolio of patents to ensure long-lasting and comprehensive intellectual property protection and to safeguard potentially valuable market expansion opportunities.
| 13 |
Our patent No. 600167 in New Zealand, which is in force until 2030 and relates to a concentrated phospholipid composition comprising 60% PL and method of using the same for treating cardiovascular diseases, has been opposed by BIO-MER Ltd. The evidentiary stage in the New Zealand patent opposition has been completed. The next step is the hearing. In our view, no new prior art has been presented that was not already considered in other jurisdictions, such as in the United States where our patents are in force.
A Notice issued from the Japan Patent Office (JPO) was received notifying that a third party filed an opposition against Acasti’s Japanese Patent No. 6346121. Acasti is awaiting further information and translation on the grounds of opposition.
Our Business and Commercialization Strategy
Key elements of our business and commercialization strategy include initially obtaining regulatory approval for CaPre in the United States for severe HTG. We plan to launch CaPre ourselves in the U.S. market. Our preferred strategy outside the United States is to commercialize CaPre through regional or country-specific strategic partnerships, and to potentially seek support and funding from each partner for in-country clinical development, registration and commercialization activities. We believe that a late development-stage and differentiated drug candidate like CaPre could be attractive to various global, regional or specialty pharmaceutical companies, and we are taking a targeted approach to partnering and licensing in various geographies.
Our key commercialization goals include:
| · | complete our TRILOGY Phase 3 program and, assuming the results are positive, file a NDA, to obtain regulatory approval for CaPre in the United States, initially for the treatment of severe HTG, with the potential to afterwards expand CaPre’s indication to the treatment of high TGs (although at least one additional clinical trial would likely be required to expand CaPre’s indication to this segment); |
| · | continue to strengthen our patent portfolio and other intellectual property rights; |
| · | continue planning for the potential launch of CaPre in the United States; and |
| · | continue to pursue strategic opportunities outside of the United States, such as licensing or similar transactions, joint ventures, partnerships, strategic alliances or alternative financing transactions, to provide development capital, market access and other strategic sources of capital. |
In addition to completing our TRILOGY Phase 3 program, we expect that additional time and capital will be required to complete the filing of an NDA to obtain FDA approval for CaPre in the United States, and to complete business development collaborations, marketing and other pre-commercialization activities before reaching the commercial launch of CaPre in the U.S.
Recent Developments
| · | On October 11, 2018, the Corporation announced the closing of its underwritten public offering in the United States of 19,090,000 Common Shares on October 9, 2018 (which includes the exercise in full by the underwriters of their over-allotment option to purchase 2,490,000 additional Common Shares), at the same public offering price of US$1.00 per Common Share for gross proceeds to the Corporation of $24.7 million (US$19.1 million) generating net proceeds to the Company of approximately $22.5 million (US$17.4 million). |
| · | On October 23, 2018, the Corporation announced the closing of its underwritten public offering in Canada of 21,562,000 Common Shares on October 23, 2018 (which includes the exercise in full by the underwriters of their over-allotment option to purchase 2,812,500 additional Common Shares), at the same public offering price of $1.28 per Common Share for gross proceeds to the Corporation of $27.6 million generating net proceeds to the Company of approximately $25.4 million. |
| · | On December 31, 2018, the Corporation announced that the two Phase 3 TRILOGY trials had essentially completed enrollment, however additional patients may continue to be enrolled through the first calendar quarter of 2019 to attain final randomization targets as needed. As of February 12, 2019, more than 74% of the required total patients for the two studies have been randomized, and more than 24% of patients who had previously been randomized in the TRILOGY program have already completed their 6 month treatment plans. This excellent progress further supports our confidence in completing these studies on schedule with topline results expected to be reported before the end of calendar 2019. |
| 14 |
| · | On January 9, 2019, the Corporation announced a Certificate for a European Patent has been issued by the European Patent Office. The granted patent is valid until 2030 and relates to a concentrated phospholipid composition and method of using the same for modulating blood lipids. This patent was validated in Belgium, Switzerland, Germany, Denmark, Spain, Finland, France, United Kingdom, Italy, Netherlands, Norway, Portugal and Sweden. |
Basis of presentation of the financial statements
The Corporation is subject to a number of risks associated with the conduct of its TRILOGY Phase 3 clinical program and its results, the establishment of strategic partnerships and the successful development of CaPre and other new products and their commercialization. The Corporation is currently not generating any revenues and has incurred significant operating losses and negative cash flows from operations since inception. To date, the Corporation has financed its operations through the public offering and private placement of Class A shares (“Common Shares”; with units consisting of Common Shares and warrants), convertible debt, proceeds from research grants and research tax credits, and exercises of warrants, rights, and options. CaPre and other drug product candidates developed by us will require approval from the FDA and equivalent regulatory organizations in other countries before they can be commercialized. To achieve the objectives of its business plan, the Corporation plans to raise the necessary funds through additional securities offerings and the establishment of strategic partnerships as well as additional research grants and research tax credits. The ability of the Corporation to achieve profitable operations is dependent on a number of factors outside of the Corporation’s control. See “Risk Factors” in this MD&A and in Acasti’s Annual Report on Form 20-F for the fiscal year ended March 31, 2018.
The Corporation has incurred operating losses and negative cash flows from operations since inception. The Corporation’s current assets of $47.7 million as at December 31, 2018 include cash and cash equivalents and marketable securities totalling $45.6 million, mainly generated by the net proceeds from the recent Public Offerings. The Corporation’s current liabilities total $13.9 million at December 31, 2018 and are comprised primarily of amounts due to or accrued for creditors. Following the October 2018 financings the Corporation expects that the total of the funds raised will be able to fund the completion of the TRILOGY phase 3 clinical trials. Management projects that additional funds will be needed in the future for activities necessary to prepare for commercial launch, including the scale up of our manufacturing operations, the completion of the potential regulatory (NDA) submission package (assuming positive Phase 3 clinical results), and the expansion of business development and US commercial launch activities. The Corporation is working towards development of strategic partner relationships, as well as actively seeking additional non-dilutive funds in the future, but there can be no assurance as to when or whether Acasti will complete any strategic collaborations or succeed in identifying non-dilutive funding sources. Consequently, the Corporation may need to raise additional equity capital in the future to fund these activities. In particular, raising additional capital is subject to market conditions and is not within the Corporation’s control. If the Corporation does not raise additional funds or find one or more strategic partners, it may not be able to realize its assets and discharge its liabilities in the normal course of business. As a result, there exists a material uncertainty that casts substantial doubt about the Corporation’s ability to continue as a going concern and, therefore, realize its assets and discharge its liabilities in the normal course of business.
The financial statements have been prepared on a going concern basis, which assumes the Corporation will continue its operations in the foreseeable future and will be able to realize its assets and discharge its liabilities and commitments in the ordinary course of business. These financial statements do not include any adjustments to the carrying values and classification of assets and liabilities and reported expenses that may be necessary if the going concern basis was not appropriate for these financial statements. If the Corporation was unable to continue as a going concern, material write-downs to the carrying values of the Corporation’s assets, including the intangible asset, could be required.
| 15 |
SELECTED FINANCIAL INFORMATION
| Three-month periods ended | Nine -month periods ended | |||||||||||||||
| December 31, 2018 | December 31, 2017 | December 31, 2018 | December 31, 2017 | |||||||||||||
| $ | $ | $ | $ | |||||||||||||
| Net loss | (4,610 | ) | (6,079 | ) | (34,760 | ) | (13,364 | ) | ||||||||
| Basic and diluted loss per share | (0.07 | ) | (0.40 | ) | (0.75 | ) | (0.90 | ) | ||||||||
| Non-IFRS operating loss1 | (9,651 | ) | (4,149 | ) | (28,062 | ) | (9,668 | ) | ||||||||
| Total assets | 59,658 | 27,425 | 59,658 | 27,425 | ||||||||||||
| Working capital2 | 33,881 | 8,495 | 33,881 | 8,495 | ||||||||||||
| Total non-current financial liabilities | 15,181 | 7,195 | 15,181 | 7,195 | ||||||||||||
| Total equity | 30,624 | 15,233 | 30,624 | 15,233 | ||||||||||||
COMMENTS ON THE SIGNIFICANT VARIATIONS OF RESULTS FROM OPERATIONS FOR THE THREE AND NINE -MONTH PERIODS ENDED DECEMBER 31, 2018 AND 2017
The net loss totaling $4,610 or ($0.07) per share for the three months ended December 31, 2018 decreased by $1,469 or ($0.33) per share from the net loss totaling $6,079 or ($0.40) per share for the three months ended December 31, 2017. This resulted primarily from a $7,029 (see “Reconciliation of Net Loss to Non-IFRS Operating Loss”) increase in financial income due mostly to a gain related to the reduction in value of the warrant derivative liability of $5,428, a decrease of $1,101 in transaction costs related to derivative warrant liabilities and by an increase of $500 mainly due to a foreign exchange gain. This gain is mostly, due to the US cash flows generated by the U.S. public financing of US$17.4 million that took place on October 9, 2018 and the US denominated accounts payable. At the time of the U.S. public financing, a major portion of the net offering was invested in US dollar investments as per the Company’s treasury policy (see “Treasury Operations”). As at December 31, 2018 US denominated cash, cash equivalents and marketable securities amounted to US$11,695 versus US$8,703 as at December 31, 2017. The decrease in net loss was offset primarily from the $5,502 increased Non-IFRS operating loss generated by planned R&D expenses to execute the TRILOGY Phase 3 clinical program and a $6 increase in stock-based compensation, and an increase of $52 in depreciation and amortization.
The net loss totaling $34,760 or ($0.75) per share for the nine months ended December 31, 2018 increased by $21,396 or ($0.15) per share from the net loss totaling $13,364 or ($0.90) per share for the nine months ended December 31, 2017. This resulted primarily from the $18,394 increased Non-IFRS operating loss generated by planned R&D expenses to execute the TRILOGY Phase 3 clinical program, and by a $2,659 increase in financial expenses due mostly to a loss related to the increased value of the warrant derivative liability of $3,888 (see “Reconciliation of Net Loss to Non-IFRS Operating Loss”), offset by a decrease of $448 in derivative warrant liability-related transaction costs and by a remaining gain of $781 mainly due to a foreign exchange gain. The increase in net loss was also caused by a $252 increase in stock-based compensation, and an increase of $91 in depreciation and amortization.
________________________________________
1 The Non-IFRS operating loss (adding to net loss financial expenses (income), depreciation and amortization, change in fair value of derivative warrant liabilities and stock-based compensation) is not a standard measure endorsed by IFRS requirements. A reconciliation to the Corporation’s net loss is presented below.
2 The working capital is presented for information purposes only and represents a measurement of the Corporation’s short-term financial health. The working capital is calculated by subtracting current liabilities from current assets. Because there is no standard method endorsed by IFRS requirements, the results may not be comparable to similar measurements presented by other public companies.
| 16 |
Breakdown of major components of the statement of earnings and comprehensive loss for the three and nine-month ended December 31, 2018 and 2017
| Research and development expenses | ||||||||||||||||
| Three-month periods ended | Nine-month periods ended | |||||||||||||||
| December 31, 2018 | December 31, 2017 | December 31, 2018 | December 31, 2017 | |||||||||||||
| $ | $ | $ | $ | |||||||||||||
| Salaries and benefits | 372 | 389 | 1,129 | 1,090 | ||||||||||||
| Research contracts | 8,349 | 2,591 | 23,492 | 4,662 | ||||||||||||
| Professional fees | 50 | 500 | 638 | 1,542 | ||||||||||||
| Other | 98 | 64 | 323 | 184 | ||||||||||||
| Government grants and tax credits | (110 | ) | (24 | ) | (290 | ) | (84 | ) | ||||||||
| Total before Stock-based compensation and depreciation and amortization | 8,759 | 3,520 | 25,292 | 7,394 | ||||||||||||
| Stock-based compensation | 74 | 94 | 183 | 217 | ||||||||||||
| Depreciation and amortization | 723 | 671 | 2,096 | 2,005 | ||||||||||||
| Total | 9,556 | 4,285 | 27,571 | 9,616 | ||||||||||||
| General and administrative expenses | ||||||||||||||||
| Three-month periods ended | Nine-month periods ended | |||||||||||||||
| December 31, 2018 | December 31, 2017 | December 31, 2018 | December 31, 2017 | |||||||||||||
| $ | $ | $ | $ | |||||||||||||
| Salaries and benefits | 460 | 330 | 1,371 | 992 | ||||||||||||
| Administrative fees | 7 | 19 | 26 | 107 | ||||||||||||
| Professional fees | 267 | 208 | 957 | 919 | ||||||||||||
| Other | 158 | 72 | 416 | 256 | ||||||||||||
| Total before Stock-based compensation | 892 | 629 | 2,770 | 2,274 | ||||||||||||
| Stock-based compensation | 262 | 236 | 730 | 444 | ||||||||||||
| Total | 1,154 | 865 | 3,500 | 2,718 | ||||||||||||
Three-month period ended December 31, 2018 compared to the three-month period ended December 31, 2017:
During the three months ended December 31, 2018, Acasti continued its planned advancement of the two-study TRILOGY Phase 3 clinical study program for its drug candidate, CaPre, in partnership with one of the world’s largest providers of biopharmaceutical development and clinical outsourcing services (“CRO”). The $9,556 in total R&D expenses for the three months ended December 31, 2018 totaled $8,759 before depreciation, amortization and stock-based compensation expense, compared to $4,285 in total R&D expenses for the three months ended December 31, 2017 or $3,520 before depreciation, amortization and stock-based compensation expense. There is a $5,239 increase in R&D expenses before depreciation, amortization and stock-based compensation which was mainly attributable to the $5,758 increase in research contracts, offset by $450 decrease in professional fees. The increased research contract expense resulted primarily from a budgeted $5,718 increase in the CRO Phase 3 clinical trial program contract expense with continued site activation and patient enrollment, randomization and treatment. The increase in R&D expense is offset by a $450 decrease in legal fees relating to services for contracting and due diligence activities performed in FY2018. The $86 increase in tax credits relates to higher R&D expenditures combined with a higher investment tax credit rate in the three months ended December 31, 2018.
G&A expenses totaling $892 before stock-based compensation expense for the three months ended December 31, 2018 increased by $263 from $629 for the three months ended December 31, 2017. This $263 increase was mainly attributable to a $130 increase in salaries and benefits primarily resulting from the expansion of the back-office team to become independent of Neptune, and the hiring of a Chief Commercial Officer to support expanded business and market development activities, slightly offset by a $12 reduction in the Neptune administrative fees. The professional fee increase of $59 was due primarily to additional legal fees resulting from independence from Neptune, including no continued internal counsel services. There was also a $86 increase in other expenses associated with risk management programs now also independent of Neptune.
| 17 |
Stock-based compensation and depreciation and amortization included in both R&D and G&A expenses are explained in the following discussion of Reconciliation of Net Loss to Non-IFRS Operating Loss.
Nine-month period ended December 31, 2018 compared to the nine-month period ended December 31, 2017:
As Acasti continued advancing its planned TRILOGY Phase 3 clinical program and production scale-up of CaPre within its R&D program, $27,571 was incurred in total R&D expenses for the nine-month period ended December 31, 2018 and $25,292 was incurred before depreciation, amortization and stock-based compensation expense. This compares to $9,616 in total R&D expenses for the nine-month period ended December 31, 2017 or $7,394 before depreciation, amortization and stock-based compensation expense. The $17,898 increase in R&D expenses before depreciation, amortization and stock-based compensation was mainly attributable to the $18,830 increase in contracts with a $17,488 increase in Phase 3 CRO contract expenses and $1,342 of increased research contracts resulting from the planned scale-up of CaPre production activities in the nine months ended December 31, 2018. This is offset by a $904 decrease in legal fees for contracting and due diligence activities. The $206 increase in tax credits relates to higher R&D expenditures combined with a higher investment tax credit rate in the nine months ended December 31, 2018.
G&A expenses totaling $2,770 before stock-based compensation expense for the nine months ended December 31, 2018 increased by $496 from $2,274 for the nine months ended December 31, 2017. This $496 increase was mainly attributable to a $379 increase in salaries and benefits primarily resulting from the expansion of the team to become more independent of Neptune, and expansion of our commercialization team and business development activities, and slightly offset by an $81 reduction in the Neptune administrative fees. There was also a $182 increase in other expenses associated with risk management programs now also independent of Neptune.
Stock-based compensation and depreciation and amortization included in both R&D and G&A expenses are explained in the following discussion of Reconciliation of Net Loss to Non-IFRS Operating Loss.
RECONCILIATION OF NET LOSS TO NON-IFRS OPERATING LOSS
| Three-month periods ended | Nine-month periods ended | |||||||||||||||
| December 31, 2018 | December 31, 2017 | December 31, 2018 | December 31, 2017 | |||||||||||||
| $ | $ | $ | $ | |||||||||||||
| Net loss | (4,610 | ) | (6,079 | ) | (34,760 | ) | (13,364 | ) | ||||||||
| Add (deduct): | ||||||||||||||||
| Stock-based compensation | 336 | 330 | 913 | 661 | ||||||||||||
| Depreciation and amortization | 723 | 671 | 2,096 | 2,005 | ||||||||||||
| Financial (income) expenses | (6,100 | ) | 929 | 3,689 | 1,030 | |||||||||||
| Non-IFRS operating loss | (9,651 | ) | (4,149 | ) | (28,062 | ) | (9,668 | ) | ||||||||
For the three-month and nine-month periods ended December 31, 2018 the Corporation recognized stock-based compensation under this plan in the amount of $336 and $913, respectively, compared to the three-month and nine -month periods ended December 31, 2017 totalling $330 and $661 respectively. The weighted average grant date fair value of the options granted to employees and directors during the nine-month period ended December 31, 2018 was $0.51 compared to the grant date value of options granted in the nine-month period ended December 31, 2017 of $1.22. No options were granted to consultants.
The depreciation and amortization expense remained relatively constant, only increasing by $52 to $723 for the three months ended December 31, 2018 from $671 for the three months ended December 31, 2017. The depreciation and amortization expense increased by $91 to $2,096 for the nine months ended December 31, 2018 from $2,005 for the nine months ended December 31, 2017, also remaining relatively constant.
| 18 |
Financial income increased by $7,029 from a loss position of $929 for the three months ended December 31, 2017 to a gain of $6,100 for the three months ended December 31, 2018. The main component of this increase resulted from the measurement of the fair value of the derivative warrant liabilities as at December 31, 2018, which resulted in a decrease to the derivative warrant liabilities included in the statement of financial position of $5,428 and a corresponding gain to change in fair value of warrant liabilities, included in financial income.
Financial expenses increased by $2,659 to $3,689 for the nine months ended December 31, 2018 from financial expenses of $1,030 for the nine months ended December 31, 2017. The main component of this increase relates to the measurement of the fair value of the derivative warrant liabilities as at December 31, 2018, which resulted in an increase to the derivative warrant liabilities included in the statement of financial position of $3,888 and a corresponding loss to change in fair value of warrant liabilities, included in financial income.
Two separate derivative warrant liabilities are included in the statement of financial position as at December 31, 2018, compared to one derivative warrant liability as at December 31, 2017. These derivative warrant liabilities stem from the financing transactions that took place in May 2018 and December 2017. The derivative warrant liabilities are re-measured at each reporting date using the Black-Scholes option pricing model. The valuations are driven by the fluctuation in the Corporation’s stock price resulting in an increased or decreased loss or gain related to the change in fair value of the warrant liabilities and increasing or decreasing the corresponding liability in the statement of financial position.
The fair value of the public offering warrants issued in May 2018 as at December 31, 2018 was determined to be approximately $0.68 per warrant, and totaled $6,951 compared to approximately $0.96 per warrant at September 30, 2018, which totaled $10,498 and compared to approximately $0.36 per warrant at June 30, 2018, which totaled $3,907.
The fair value of the derivative warrants issued with the U.S. public offering of December 27, 2017 as at December 31, 2018, totaled $6,464 or approximately $0.66 per warrant, compared to the fair value of these warrants totaling $9,358 or approximately $0.95 per warrant at September 30, 2018, compared to the fair value of these warrants totaling $3,558 or approximately $0.36 per warrant at June 30, 2018 and compared to the fair value of these warrants totaling $6,405 or approximately $0.65 at March 31, 2018.
As at December 31, 2018, the fair value of the liability of the warrants issued as part of Acasti’s December 2013 securities offering was at NIL as the warrants expired December 3, 2018. As at September 30, 2018 and June 30, 2018, the value the derivative warrant liability was calculated at NIL and $21 less than the $21 fair value at March 31, 2018.
| 19 |
SELECTED QUARTERLY FINANCIAL DATA
| December 31, | September 30, | June 30, | March 31, | |||||||||||||
| 2018 | 2018 | 2018 | 2018 | |||||||||||||
| $ | $ | $ | $ | |||||||||||||
| Net loss | (4,610 | ) | (22,729 | ) | (7,421 | ) | (8,140 | ) | ||||||||
| Add (deduct): | ||||||||||||||||
| Depreciation and amortization | 723 | 689 | 684 | 667 | ||||||||||||
| Stock based compensation | 336 | 326 | 251 | 268 | ||||||||||||
| Financial (income) expense | (6,100 | ) | 12,291 | (2,502 | ) | 778 | ||||||||||
| Non-IFRS operating loss | (9,651 | ) | (9,423 | ) | (8,988 | ) | (6,427 | ) | ||||||||
| Basic and diluted net loss per share | (0.07 | ) | (0.62 | ) | (0.23 | ) | (0.32 | ) | ||||||||
| December 31, | September 30, | June 30, | March 31, | |||||||||||||
| 2017 | 2017 | 2017 | 20173,4 | |||||||||||||
| $ | $ | $ | $ | |||||||||||||
| Net loss | (6,079 | ) | (4,507 | ) | (2,778 | ) | (3,366 | ) | ||||||||
| Add (deduct): | ||||||||||||||||
| Depreciation and amortization | 671 | 667 | 667 | 894 | ||||||||||||
| Stock based compensation | 330 | 295 | 36 | 244 | ||||||||||||
| Financial (income) expense | 929 | 122 | (21 | ) | 206 | |||||||||||
| Deferred income tax recovery | - | - | - | (129 | ) | |||||||||||
| Non-IFRS operating loss | (4,149 | ) | (3,423 | ) | (2,096 | ) | (2,151 | ) | ||||||||
| Basic and diluted net loss per share | (0.40 | ) | (0.31 | ) | (0.19 | ) | (0.28 | ) | ||||||||
The quarterly year-to-year non-IFRS operating loss variances are mainly attributable to fluctuations in R&D expenses from quarter-to-quarter as well as an increase in G&A expenses over the last four quarters as the Corporation established an administrative and finance team independent from Neptune and expanded business development and pre-commercialization activities. The increase in net loss, net loss per share in the third quarter of fiscal 2019 compared to the third quarter of fiscal 2018 can primarily be explained by the costs incurred in CRO expenses associated with its TRILOGY Phase 3 clinical trial program. The increases in net loss from quarter to quarter, in addition to the increased non-IFRS operating losses, are mainly due to the changes in fair value of the derivative warrant liabilities as well as variations in foreign exchange gains or losses.
________________________________________
3 This fiscal quarter represents a period of four months ended March 31, 2017.
4 Beginning in fiscal 2017, the Corporation’s year end is March 31. Previously, the Corporation’s fiscal year end was February 28. As a result, 1 of the 8 quarters of selected financial data is from different ending periods.
| 20 |
LIQUIDITY AND CAPITAL RESOURCES
Share Capital Structure
The Corporation’s authorized share capital consists of an unlimited number of Class A, Class B, Class C, Class D and Class E shares, without par value. Issued and outstanding fully paid shares, stock options, restricted shares units and warrants, were as follows for the periods ended:
| December 31, 2018 | March 31, 2018 | |||||||
| Number outstanding | Number outstanding | |||||||
| Class A shares, voting, participating and without par value | 78,128,567 | 25,638,215 | ||||||
| Stock options granted and outstanding | 4,250,011 | 2,284,388 | ||||||
| May 2018 public offering of warrants exercisable at $1.31, until May 9, 2023 | 10,188,100 | - | ||||||
| Public offering broker warrants May 2018 exercisable at $1.05 until May 9, 2023 | 547,975 | - | ||||||
December 2017 U.S. public offering of warrants exercisable at US$1.26, until December 27, 2022 | 9,801,861 | 9,802,935 | ||||||
December 2017 U.S. broker warrants exercisable at US$1.2625, until December 27, 2022 | 495,050 | 495,050 | ||||||
| February 2017 public offering of warrants exercisable at $2.15, until February 21, 2022 | 1,904,034 | 1,904,034 | ||||||
| 2017 unsecured convertible debentures conversion option contingent warrants exercisable at $1.90, until February 21, 20205 | 1,052,630 | 1,052,630 | ||||||
| Series 8 warrants exercisable at US$15.00, until December 3, 20186 | - | 1,840,000 | ||||||
| Series 9 warrants exercisable at $13.30 until December 3, 2018 | - | 161,654 | ||||||
| Total fully diluted shares | 106,368,228 | 43,178,906 | ||||||
Comparison of cash Flows and financial condition between the three and nine-month periods ended December 31, 2018 and 2017
Summary
As at December 31, 2018, cash and cash equivalents totaled $28,893 with a net increase in cash and cash equivalents totaling $22,924 for the three-month period ended December 31, 2018 and sources of cash totaling $20,670 for the nine-month period ended December 31, 2018. This compares to $12,475 in total cash and cash equivalents as at December 31, 2017 with a with a net increase in cash and cash equivalents totaling $7,146 for the three-month period ended December 31, 2017 and a source of cash totaling $2,703 for the nine-month period ended December 31, 2017.
Operating activities
During the three months ended December 31, 2018 and December 31, 2017, the Corporation’s operating activities used cash of $9,966 and $4,451, respectively, and during the nine months ended December 31, 2018 and December 31, 2017, the Corporation’s operating activities used cash of $22,146 and $8,157, respectively (see “Reconciliation of Net Loss to Non-IFRS Operating Loss”), further modified by changes in working capital, excluding cash.
Investing activities
During the three months ended December 31, 2018, the Corporation’s investing activities used cash of $16,820 compared to a use of cash of $131 for the three months ended December 31, 2017. The significant increase in cash used by investing activities during the three months ended December 31, 2018 resulted from Acasti’s investment in marketable securities due to cash on hand following the financings in October 2018. Additionally, the increase was due to the acquisition of equipment of $184, offset by interest received of $84. Cash used by investing activities during the three months ended December 31, 2017 was due to the acquisition of equipment of $140, offset by interest received of $9.
________________________________________
5 The debentures are convertible into Common Shares at a fixed price of $1.90 per Common Share except if the Corporation pays before the maturity, all or any portion of the convertible debentures. Should the Corporation pay all or any portion of the convertible debentures before maturity, then warrants become exercisable at $1.90 per Common Share for the equivalent convertible debenture amount prepaid.
6 Total of 18,400,000 warrants. In order to obtain one Common Share, 10 warrants must be exercised for a total amount of US$15.00.
| 21 |
During the nine months ended December 31, 2018, the Corporation’s investing activities used cash of $17,284 compared to a use of cash of $288 for the nine months ended December 31, 2017. As explained above, the significant increase in cash used by investing activities resulted from Acasti’s investment in a marketable securities due to cash on hand following the financings in October 2018. Additionally, cash used by investing activities during the nine months ended December 31, 2018 was due to the acquisition of equipment of $728, offset by interest received of $164. Cash used by investing activities during the nine months ended December 31, 2017 was due to the acquisition of equipment of $327, offset by interest received of $39.
Financing activities
During the three months ended December 31, 2018, the Corporation’s financing activities generated cash of $49,034 due primarily to the net proceeds from the public offerings of $48,024 and proceeds from warrants exercised related to the May 2018 public offering (see “Derivative warrant liabilities”) of $1,011. For December 31, 2017 the Corporation generated cash of $11,864 due primarily to the net proceeds from the public offering of $11,481.
During the nine months ended December 31, 2018, the Corporation’s financing activities generated cash of $59,345 mainly from the net proceeds of the public offerings of $58,337 and proceeds from warrants exercised related to the May 2018 public offering (see “Derivative warrant liabilities”) of $1,011. For the nine months ended December 31, 2017 the Corporation generated cash of $11,442 mainly from the net proceeds of the public offering of $11,100.
See basis of presentation for additional discussion of the Corporation’s financial condition, including the need for additional funds and the material uncertainty that casts substantial doubt about our ability to continue as a going concern.
ATM Program
On February 14, 2019, the Corporation entered into an “at-the-market” (“ATM”) sales agreement with B. Riley FBR, Inc., pursuant to which the Corporation’s common shares may be sold from time to time for aggregate gross proceeds of up to US $30 million, with sales only being made on the NASDAQ Stock Market. The common shares will be distributed at market prices prevailing at the time of the sale and, as a result, prices may vary between purchasers and during the period of distribution. The volume and timing of sales under the ATM program, if any, will be determined at the sole discretion of the Corporation’s board of Directors and management.
October 2018 Public Offering
On October 9, 2018, the Company closed a U.S. public offering of 16,600,000 Common Shares at a price of US$1.00 per share. In addition, the underwriters fully exercised their over-allotment option to purchase 2,490,000 additional Common Shares at the same public offering price. This offering generated gross proceeds of $24.7 million (US$19.1 million), which resulted in net proceeds to the Company of $22.5 million (US$17.4 million) and a total of 19,090,000 Common Shares issued.
On October 23, 2018, the Company closed a Canadian public offering of 18,750,000 Common Shares at a price of $1.28 per share. In addition, the underwriters fully exercised their over-allotment option to purchase 2,812,500 additional Common Shares at the same public offering price. This offering generated gross proceeds of $27.6 million, which resulted in net proceeds to the Company of approximately $25.4 million and a total of 21,562,500 Common Shares issued.
May 2018 Public Offering
On May 9, 2018 the Corporation closed a Canadian public offering issuing 9,530,000 units of Acasti (“Units”) at a price of $1.05 per Unit for gross proceeds of $10 million. The units issued consist of 9,530,000 Common Shares and 9,530,000 Warrants. Each Warrant entitles the holder thereof to acquire one Common Share of the Corporation at an exercise price of $1.31 at any time until May 9, 2023.
On May 14, 2018, the underwriters exercised their over-allotment option by purchasing an additional 1,429,500 units at a price of $1.05 per Unit, for additional gross proceeds of $1.5 million. The units issued consist of 1,429,500 Common Shares and 1,429,500 warrants. Each Warrant entitles the holder thereof to acquire one Common Share of the Corporation at an exercise price of $1.31 at any time until May 9, 2023.
The warrant component of these Units are Derivative Warrant Liabilities for accounting purposes due to the warrant agreement, which contains certain contingent provisions that allow for cash settlement. The proceeds of the offering are required to be split between the Derivative Warrant Liabilities and the equity-classified Common shares at the time of issuance of the Units. The fair value of the Derivative Warrant Liabilities at the time of issuance was determined to be $4.3 million and the residual of the proceeds of $6.2 million was allocated to the Common Shares. Issuance costs related to this transaction totaled approximately $1.8 million and have been allocated between the Derivative Warrant Liabilities and Common shares based on relative value. Resulting from this allocation, $0.7 million has been allocated to the Derivative Warrant Liability and is recognized in finance costs in the Statements of Earnings and Comprehensive Loss, whereas the remaining portion of $1.1 million in issuance costs was allocated to the Common Shares and recognized as a reduction to share capital, in the Statements of Financial Position.
| 22 |
The weighted average fair value of the 2018 Warrants issued in May 2018 was determined to be $0.39 per warrant. Changes in the fair value of the 2018 Warrants are recognized in finance expense.
As part of the May financing, the Company also issued broker warrants to purchase up to 547,975 Common Shares. Each broker warrant entitles the holder thereof to acquire one Common Share of the Corporation at an exercise price of $1.05, at any time until May 9, 2023. The broker warrants are considered for compensation to non-employees under IFRS 2, stock-based compensation, and are accounted for at fair value at issuance date and not subsequently revalued.
Financial Position
The following table details the significant changes to the statements of financial position as at December 31, 2018 compared to the prior fiscal period end at March 31, 2018:
| Accounts |
Increase (Decrease) |
Comments |
| Cash and cash equivalents | 20,670 | See cash flow statement |
| Marketable securities – current and long term | 16,720 |
See cash flow statement |
| Receivable | 1,123 | Timing of receipts |
| Prepaid expenses | (219) | Advancement of contracts |
| Other Asset – current and long term | (40) | Usage of Krill Oil supply |
| Equipment | 187 | Acquisition of equipment and depreciation |
| Intangible asset | (1,742) | Amortization |
| Trade and other payables | 7,156 | Increased expenses and accruals |
| Derivative warrant liabilities | 6,989 | Issuance of derivative warrants and change in fair value |
| Unsecured convertible debentures | 154 | Accretion of interest |
See the statement of changes in equity in the Corporation’s financial statements for details of changes to the equity accounts since December 31, 2018.
Treasury Operations
The Company’s treasury policy is to invest cash that is not required immediately into instruments with an investment strategy based on capital preservation. Cash equivalents and marketable securities are primarily made in guaranteed investment certificates (GICs), term deposits and high-interest savings accounts, which are issued and held with Canadian chartered banks; high rated promissory notes issued by government bodies and commercial paper. The Company holds cash denominated in both US and CAD dollars. Funds received in US dollars from the equity private placement are invested as per the Company’s treasury policy in US dollar investments and converted to CAD dollars as appropriate to fulfill operational requirements and funding.
Derivative warrant liabilities
The 2018 Warrants issued as part of the Corporation’s May 2018 public offering were recognized as Derivative Warrant Liabilities with a fair value of $4,272. As of December 31, 2018, the Derivative Warrant Liabilities for the 2018 Warrants totaled $6,951, which represents the fair value of these warrants. The weighted average fair value of the 2018 Warrants issued was determined to be $0.39 per warrant at inception and approximately $0.68 per 2018 Warrant as at December 31, 2018.
| 23 |
On December 27, 2017, warrants were issued as part of the Corporation’s U.S. public offering and recognized as Derivative Warrant Liabilities with a fair value of $5,873 (“2017 Warrants”). The 2017 Warrants are Derivative Warrant Liabilities for accounting purposes due to the currency of the exercise price (US$) being different from the Corporation’s Canadian dollar functional currency. The fair value of the 2017 Warrants is revalued at each reporting date. As of December 31, 2018, the Derivative Warrant Liabilities sourced from the 2017 Warrants totaled $6,464 which represents the fair value of these warrants. The fair value of the 2017 Warrants issued in connection with the offering was determined to be $0.60 per warrant upon issuance and approximately $0.66 per warrant as of December 31, 2018.
As of December 31, 2018, the fair value of the Derivative Warrant Liabilities of the warrants issued as part of Acasti’s Series 8 December 2013 securities offering was at NIL as the warrants expired December 3, 2018.
During October 2018, 771,400 2018 Warrants were exercised with one Common Share of the Company acquired with each 2018 Warrant exercised at an exercise price of $1.31. Aggregate gross proceeds of approximately $1.0 million were received. In addition, 4,455 2017 Warrants were exercised in a cashless manner to acquire 1,074 Common Shares of the Company. A total of 772,474 Common Shares were issued as a result of 775,855 warrants exercised.
Contractual Obligations, Off-Balance-Sheet Arrangements and Commitments
As at December 31, 2018, the Corporation’s liabilities total $29,034, of which $13,853 is due within twelve months, $13,415 relates to Derivative Warrant Liabilities that will likely be settled by issuing Common Shares in exchange for proceeds equal to the strike price of the instrument, and $1,766 of outstanding unsecured convertible debentures is also projected to be settled in Common Shares. However, the principal amount of unsecured convertible debentures may be prepaid, in whole or in part, at any time and from time to time, in cash, at the sole discretion of the Corporation. The debentures are convertible into Common Shares at a fixed price of $1.90 per Common Share except if the Corporation pays before the maturity, all or any portion of the convertible debentures.
The Corporation has also entered into a contract to purchase production equipment to be used in the manufacturing of the clinical and future commercial supply of CaPre.
A summary of the contractual obligations at December 31, 2018, is as follows:
| Carrying value | Total contractual cash flows | 1 year or less | 1 to 3 years | |||||||||||||
| $ | $ | $ | $ | |||||||||||||
| Trade, other payables and due to related party | 13,853 | 13,853 | 13,853 | - | ||||||||||||
| Lease | 99 | 99 | 79 | 20 | ||||||||||||
| Unsecured convertible debentures | 1,766 | 2,182 | 160 | 2,022 | ||||||||||||
| Total | 15,718 | 16,134 | 14,092 | 2,042 | ||||||||||||
Research and development contracts and contract research organizations agreements
The Corporation utilizes CMOs for the development and production of clinical materials and research organizations to perform services related to the Corporation’s clinical trials. Pursuant to the agreements with these contract manufacturing and contract research organizations, the Corporation has either the right to terminate the agreements without penalties or under certain penalty conditions. For agreements which contain penalty conditions, the Company would be required to pay penalties of approximately $142.
| 24 |
Lease
During FY 2018, the Company entered into a lease agreement for its research and development and quality control laboratory facility located in Sherbrooke, Québec, resulting in a commitment of $99 over the remaining lease term. An amount of $79 is committed in the next year, with a remaining committed amount of $20 over the second year of the lease.
Contingencies
A former CEO of the Corporation is claiming the payment of approximately $8.5 million and the issuance of equity instruments as severance entitlements under his employment contract from the Neptune group (including Acasti). The Corporation’s management intends to vigorously defend against this claim and, as it believes that it is not valid, no provision has been recognized. The Neptune group (including Acasti) has filed a claim to recover certain amounts from the former officer. All outstanding share-based payments held by the former CEO have been cancelled during the year ended February 28, 2015. A trial date is currently scheduled for hearing in May and June 2019.
The Corporation may also be involved in other matters arising in the ordinary course of its business. Since management believes that all related claims are not valid and it presently is not possible to determine the outcome of these matters, no provisions have been made in the financial statements for their ultimate resolution beyond the amounts incurred and recorded for such matters. The resolution of such matters could have an effect on the Corporation’s financial statements in the year that a determination is made. However, in management's opinion, the final resolution of all such matters is not projected to have a material adverse effect on the Corporation’s financial position.
Related Party Transactions
The Corporation was charged by Neptune, its former parent company, for the purchase of research supplies and for certain costs incurred by Neptune for the benefit of the Corporation, as follows:
| Three-month periods ended | Nine-month periods ended | |||||||||||||||
| December 31, 2018 | December 31, 2017 | December 31, 2018 | December 31, 2017 | |||||||||||||
| $ | $ | $ | $ | |||||||||||||
| Research and development expenses | ||||||||||||||||
| Supplies and incremental costs | - | 1 | - | 7 | ||||||||||||
| Shared service agreement | - | - | - | 20 | ||||||||||||
| - | 1 | - | 27 | |||||||||||||
| General and administrative expenses | ||||||||||||||||
| Supplies and incremental costs | 61 | 65 | 172 | 173 | ||||||||||||
| Shared service agreement | 7 | 19 | 26 | 107 | ||||||||||||
| 68 | 84 | 198 | 280 | |||||||||||||
| 68 | 85 | 198 | 307 | |||||||||||||
Where Neptune incurs specific incremental costs for the benefit of the Corporation, it charges those amounts directly. Neptune provides Acasti with the services of personnel for certain administrative work as part of a shared service agreement. The employees’ salaries and benefits are charged proportionally to the time allocation agreed upon within the shared service agreement. Effective September 30, 2017, the laboratory support, the corporate affairs and the public company reporting services previously provided by Neptune as part of the shared service agreement were discontinued. The Corporation is now incurring incremental costs and expects to do so in the future, partially offset by reduced shared service fees. The account payable to Neptune amounted to $43 and $29 at December 31, 2018 and 2017, respectively and is non-interest bearing and has no specified maturity date. These charges do not represent all charges incurred by Neptune that may have benefited the Corporation. Also, these charges do not necessarily represent the cost that the Corporation would otherwise need to incur, should it not receive these services or benefits through the shared resources of Neptune.
| 25 |
During the three and nine months ended December 31, 2018, the Corporation recognized expenses of $61 and $172, respectively in G&A expenses in relation to supplies and incremental costs, compared to $65 and $173, respectively, for the three and nine months ended December 31, 2017 which are comparable. As the R&D and quality control laboratory facility is now completely independent of the Neptune facility, there were no related party charges for R&D as at December 31, 2018.
In addition, Neptune provided Acasti with the services of personnel for certain of its administrative, legal and laboratory work as part of a shared service agreement. The employees’ salaries and benefits are charged proportionally to the time allocation agreed upon. In the three months and nine months ended December 31, 2018, the Corporation recognized an expense of $7 and $26, respectively, in G&A expenses under the shared service agreement compared to $19 and $107, respectively, for the three and nine months ended December 31, 2017, which is a significant reduction mainly due to an independent account team established during FY 2018. For R&D, there were no expenses related to the shared services agreement in the current year as the agreement was discontinued with Neptune for R&D purposes as at September 30, 2017.
Historically, Neptune has provided the Corporation with the raw krill oil needed to produce CaPre for Acasti’s clinical programs, including all of the raw krill oil projected as needed for its Phase 3 clinical study program. However, Neptune discontinued its krill oil production and sold its krill oil inventory to Aker on August 7, 2017. The Corporation is continually evaluating alternative suppliers of raw krill oil. At December 31, 2018, a reserve of raw krill oil was still stored at Neptune’s facility.
The key management personnel are the officers of the Corporation and the members of the Board of Directors of the Corporation. They control in the aggregate less than 1% of the voting shares of the Corporation (1% at December 31, 2017). See note 6 to the financial statements for disclosures of key management personnel compensation.
Changes in Accounting Policies
The accounting policies and basis of measurement applied in these interim financial statements are the same as those applied by the Corporation in its financial statements for the year ended March 31, 2018 except as they include the adoption of new standards, and amendments to standards, which are effective for the period beginning on April 1, 2018 and have been adopted by the Corporation.
New standards and interpretations:
| (i) | Financial instruments: |
On July 24, 2014, the International Accounting Standards Board (IASB) issued the final version of IFRS 9, Financial Instruments, replacing IAS 39, Financial Instruments: Recognition and Measurement. IFRS 9 introduces a revised approach for the classification of financial assets based on how an entity manages financial assets and the characteristics of the contractual cash flows of the financial assets replacing the multiple rules in IAS 39. Most of the requirements in IAS 39 for classification and measurement of financial liabilities have been carried forward in IFRS 9. IFRS 9 also introduces a new hedge accounting model that is more closely aligned with risk-management activities and a new expected credit loss model for calculating impairment on financial assets replacing the incurred loss model in IAS 39. The Corporation assessed the impact of the adoption of IFRS 9 on its financial statements, and determined there was no material impact. The Corporation does not apply hedge accounting.
| (ii) | Amendments to IFRS 2 – Classification and Measurement of Share-Based Payment Transactions: |
On June 20, 2016, the IASB issued amendments to IFRS 2, Share-Based Payment, clarifying how to account for certain types of share-based payment transactions. The amendments apply for annual periods beginning on or after January 1, 2018. Earlier application was permitted. As a practical simplification, the amendments can be applied prospectively. Retrospective, or early application was permitted if information was available without the use of hindsight. The amendments provide requirements on the accounting for: the effects of vesting and non-vesting conditions on the measurement of cash-settled share-based payments; share-based payment transactions with a net settlement feature for withholding tax obligations; and a modification to the terms and conditions of a share-based payment that changes the classification of the transaction from cash-settled to equity-settled. The Corporation assessed the impact of the adoption of IFRS 2 on its financial statements, and determined there was no material impact.
| 26 |
New standards and interpretations not yet adopted:
The following accounting standards, interpretations and amendments to existing standards were issued by the International Accounting Standards Board (“IASB”) or the IFRS Interpretations Committee (IFRIC) that are mandatory but not yet effective for the period ended December 31, 2018 which have a material impact on the disclosures, the financial position or results of operations of the Corporation. The Corporation intends to adopt these standards when they become effective.
| (iii) | Leases – IFRS 16 |
IFRS 16, Leases (“IFRS 16”) In January 2016, the IASB issued IFRS 16, a new standard that replaces IAS 17, Leases. IFRS 16 is a major revision of the way in which companies account for leases and will no longer permit off balance sheet leases. Adoption of IFRS 16 is mandatory and will be effective for the Corporation’s fiscal year beginning on or after January 1, 2019. The Corporation is assessing the impact of adoption of IFRS 16, and currently there is only one lease that will be impacted by this new standard at a minimal impact. The Corporation and does not intend to early adopt this standard in its financial statements.
Controls and procedures
In accordance with the Canadian Securities Administrators’ National Instrument 52-109, the Corporation has filed certificates signed by the Corporation’s Chief Executive Officer (“CEO”) and Chief Financial Officer (“CFO”) that among other things, report on the design of disclosure controls and procedures and the design of internal control over financial reporting.
Changes in internal control over financial reporting (“ICFR”)
There have been no changes in the Corporation’s ICFR during the three-month period ended December 31, 2018 that have materially affected, or are reasonably likely to materially affect its ICFR.
RISK FACTORS
Investing in Acasti’s securities involves a high degree of risk due to, among other things, the nature of our business and the present stage of our development. Prospective and current investors should carefully consider the following risks and uncertainties, together with all other information in this MD&A, as well as our financial statements and the risks described in more detail in Item 3. “Risk Factors” and “Item 5. Operating and Financial Review and Prospects” in our Annual Report on Form 20-F for the fiscal year ended March 31, 2018 and our other public filings. If any of these risks actually occur, Acasti’s business, financial condition, prospects, results of operations or cash flow could be materially and adversely affected and all or a part of the value of an investor’s investment in Acasti can be lost. Additional risks or uncertainties not currently known to Acasti, or that we currently deem immaterial, may also negatively affect our business operations.
General Risks Related to the Corporation
| · | We may not be able to maintain our operations and advance our research and development of CaPre without additional funding. |
| · | We may never become profitable or be able to sustain profitability. |
| · | If outcome studies being conducted by our competitors testing the impact of OM3 on treating patients with high TGs are negative, there could also be an adverse impact for CaPre. |
| · | We are and will continue to rely on third parties to conduct our TRILOGY Phase 3 program for CaPre. |
| · | We rely on third parties to manufacture, produce and supply CaPre and we may be adversely affected if those third parties are unable or unwilling to fulfill their obligations, including complying with FDA requirements. |
| · | We have historically had no marketing and sales organization and, as a company, no history in marketing products. If we are unable to properly establish marketing and sales capabilities or enter into agreements with a strategic partner to market and sell CaPre, we may not be able to generate revenue. |
| 27 |
| · | If we are not successful in attracting and retaining highly qualified personnel, we may not be able to successfully implement our business strategy. |
| · | Business disruptions could seriously harm our future revenue and financial condition and increase our costs and expenses. |
| · | Our prospects currently depend entirely on the success of CaPre, which is still in clinical development, and we may not be able to generate revenues from CaPre. |
| · | If we encounter difficulties enrolling patients in our planned TRILOGY Phase 3 program, our development activities for CaPre could be delayed or otherwise adversely affected. |
| · | We may not be able to obtain required regulatory approvals for CaPre. |
| · | Even if we receive regulatory approval for CaPre, it may just be for a limited indication. |
| · | We may be unable to find successful strategic partnerships to develop and commercialize CaPre. |
| · | We may be unable to develop alternative product candidates. |
| · | We may not be able to compete effectively against our competitors’ pharmaceutical products. |
| · | CaPre could face competition from products for which no prescription is required. |
| · | Recent and future legal developments could make it more difficult and costly for us to obtain regulatory approvals for CaPre and negatively affect the prices we may charge. |
| · | Reimbursement decisions by third-party payors may have an adverse effect on pricing and market acceptance. If there is not sufficient reimbursement for CaPre, it is less likely that it will be widely used. |
| · | Even if we obtain FDA approval of CaPre, we may never obtain approval or commercialize it outside of the United States, which would limit our ability to realize CaPre’s full market potential. |
| · | If we or our third-party service providers fail to comply with healthcare laws and regulations or government price reporting laws, we could be subject to civil or criminal penalties. |
| · | We depend on Neptune for certain administrative services. |
| · | The research, development and manufacture of CaPre involves using potentially hazardous materials. |
| · | Interruptions of our supply of CaPre could disrupt our planned TRILOGY Phase 3 program and, if CaPre reaches commercialization, impair any future revenue streams. |
| · | If product liability lawsuits are brought against us, we may incur substantial liabilities and be required to cease the sale, marketing and distribution of CaPre. We may not achieve our publicly announced milestones on time, or at all. |
| · | The outcome of ongoing litigation is uncertain. |
| · | We may be subject to foreign exchange rate fluctuations. |
| · | While there is no indication of this in previous studies, CaPre may cause or be perceived to cause undesirable side effects or have other properties that could delay or prevent its regulatory approval, limit the commercial profile of an approved label, or result in significant negative consequences following marketing approval, if any. |
Risks Related to Intellectual Property
| · | In addition to our own patents, CaPre is covered by patents that are sublicensed to us by Neptune. |
| · | It is difficult and costly to protect our intellectual property rights. |
| 28 |
| · | CaPre may infringe the intellectual property rights of others, which could increase our costs and delay or prevent our development and commercialization efforts. |
| · | If we do not protect our trademark for CaPre, we may not be able to build name recognition in our markets of interest. |
| · | We may be involved in lawsuits to protect or enforce our patents or the patents of our licensors, which could be expensive, time-consuming and unsuccessful. |
| · | Changes in patent law could diminish the value of patents in general, thereby impairing our ability to protect CaPre and any of our other future product candidates. |
| · | We may not be able to protect our intellectual property rights throughout the world. |
Risks Relating to Our Common Shares
| · | The price of our common shares may be volatile. |
| · | Forward-Looking Statements may prove to be inaccurate. |
| · | Raising additional capital may cause dilution to our existing shareholders, restrict our operations or require us to relinquish rights to our technologies or product candidates. |
| · | There can be no assurance that an active market for our common shares will be sustained. |
| · | A large number of common shares may be issued and subsequently sold upon the exercise of existing warrants. The sale or availability for sale of existing warrants or other securities convertible in common shares may depress the price of our common shares. |
| · | We do not currently intend to pay any cash dividends on our common shares in the foreseeable future. |
| · | If we fail to meet applicable listing requirements, the NASDAQ Stock Market or the TSXV may delist our common shares from trading, in which case the liquidity and market price of our common shares could decline. |
| · | We may pursue opportunities or transactions that adversely affect our business and financial condition. |
| · | As a foreign private issuer, we are subject to different U.S. securities laws and regulations than a domestic U.S. issuer, which may limit the information publicly available to our U.S. shareholders. |
| · | As an “emerging growth company”, we are exempt from the requirement to comply with the auditor attestation requirements of the Sarbanes-Oxley Act. |
| · | U.S. investors may be unable to enforce certain judgments. |
| 29 |
Additional Information
Updated and additional information about the Corporation is available on SEDAR at www.sedar.com or on EDGAR at www.sec.gov/edgar.shtml.
As at February 13, 2019, the Corporation’s capital structure is as follows:
| Number
outstanding | ||||
| Class A shares, voting, participating and without par value | 78,128,567 | |||
| Stock options granted and outstanding | 4,250,011 | |||
| May 2018 public offering of warrants exercisable at $1.31, until May 9, 2023 | 10,188,100 | |||
| Public offering broker warrants May 2018 exercisable at $1.05 until May 9, 2023 | 547,975 | |||
| December 2017 U.S. public offering of warrants exercisable at US$1.26, until December 27, 2022 | 9,801,861 | |||
| December 2017 U.S. broker warrants exercisable at US$1.2625, until December 27, 2022 | 495,050 | |||
| February 2017 public offering of warrants exercisable at $2.15 until February 21, 2022 | 1,904,034 | |||
| 2017 unsecured convertible debentures conversion option contingent warrants exercisable at $1.90, until February 21, 20207 | 1,052,630 | |||
| Total fully diluted shares | 106,364,847 | |||
________________________________________
7 The debentures are convertible into Common Shares at a fixed price of $1.90 per Common Share except if the Corporation pays before the maturity, all or any portion of the convertible debentures. Should the Corporation pay all or any portion of the convertible debenture before maturity, then warrants become exercisable at $1.90 per Common Share for the equivalent convertible debenture amount prepaid.
30